Spark is distributed with the Metrics Java library which can greatly enhance your abilities to diagnose issues with your Spark jobs.
In this tutorial, we’ll cover how to configure Metrics to report to a Graphite backend and view the results with Grafana for Spark Performance Monitoring purposes.
Table of Contents
Spark Performance Monitoring Background
If you already know about Metrics, Graphite and Grafana, you can skip this section. But for those of you that do not, here is some quick background on these tools.
Metrics is described as “Metrics provides a powerful toolkit of ways to measure the behavior of critical components in your production environment”. Similar to other open source applications, such as Apache Cassandra, Spark is deployed with Metrics support. In this post, we’re going to configure Metrics to report to a Graphite backend. Graphite is described as “Graphite is an enterprise-ready monitoring tool that runs equally well on cheap hardware or Cloud infrastructure”. Finally, we’re going to view metric data collected in Graphite from Grafana which is “the leading tool for querying and visualizing time series and metrics”.
This Spark Performance Monitoring tutorial is just one approach to how Metrics can be utilized for Spark monitoring. Metrics is flexible and can be configured to report other options besides Graphite. Check out the Metrics docs for more which is in the Reference section below.
Sample App Requirements
- Spark
- Cassandra
Spark Performance Monitoring Overview
We’re going to move quickly. I assume you already have Spark downloaded and running. We’re going to configure your Spark environment to use Metrics reporting to a Graphite backend. We’ll download a sample application to use to collect metrics. Finally, for illustrative purposes and to keep things moving quickly, we’re going to use a hosted Graphite/Grafana service. YMMV. Please adjust accordingly.
Outline
- Sign up for Graphite/Grafana service
- Configure Metrics
- Clone and run the sample application with Spark Components
- Confirm Graphite and Configure Grafana
- Eat, drink, be merry
Let’s do this.
1. Sign up for Graphite/Grafana Service
Sign up for a free trial account at http://hostedgraphite.com. At the time of this writing, they do NOT require a credit card during sign up. After signing up/logging in, you’ll be at the “Overview” page where you can retrieve your API Key as shown here
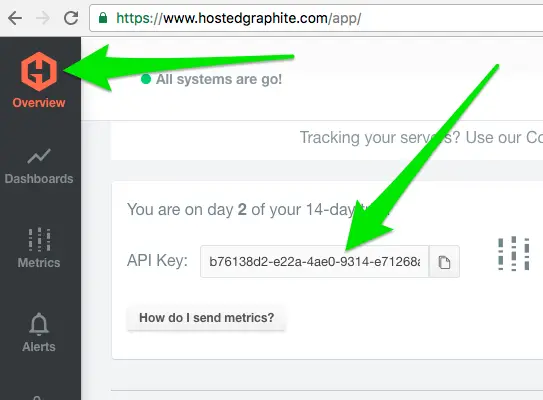
Done. Movin on.
2. Configure Metrics
Go to your Spark root dir and enter the conf/ directory. There should be a `metrics.properties.template` file present. Copy this file to create a new one. For example on a *nix based machine, `cp metrics.properties.template metrics.properties`. Open `metrics.properties` in a text editor and do 2 things:
2.1 Uncomment lines at the bottom of the file
master.source.jvm.class=org.apache.spark.metrics.source.JvmSource

worker.source.jvm.class=org.apache.spark.metrics.source.JvmSource

driver.source.jvm.class=org.apache.spark.metrics.source.JvmSource

executor.source.jvm.class=org.apache.spark.metrics.source.JvmSource
2.2 Add the following lines and update the `*.sink.graphite.prefix` with your API Key from the previous step
*.sink.graphite.class=org.apache.spark.metrics.sink.GraphiteSink

*.sink.graphite.host=carbon.hostedgraphite.com

*.sink.graphite.port=2003

*.sink.graphite.period=10

*.sink.graphite.unit=seconds

*.sink.graphite.prefix=<your-api-key-from-previous-step>
Kapow. Done. Moving on.
3. Clone and run sample application
We’re going to use Killrweather for the sample app. It requires a Cassandra backend. If you don’t have Cassandra installed yet, do that first. Don’t complain, it’s simple.
3.1 Clone Killrweather
`git clone https://github.com/killrweather/killrweather.git`
3.2 Switch to `version_upgrade` branch *
`cd killrweather`
`git checkout version_upgrade`
* We’re using the version_upgrade branch because the Streaming portion of the app has been extrapolated into it’s own module.
3.3 Prepare Cassandra
To prepare Cassandra, we run two `cql` scripts within `cqlsh`. Super easy if you are familiar with Cassandra. And if not, watch the screencast mentioned in Reference section below to see me go through the steps. In essence, start `cqlsh` from the killrvideo/data directory and then run
 cqlsh> source 'create-timeseries.cql';
 cqlsh> source 'load-timeseries.cql';
3.4 Start-up app
`sbt run/app`
3.5 Package Streaming Jar to deploy to Spark
`sbt streaming/package`
3.6 Deploy JAR
Example from the killrweather/killrweather-streaming directory:
~/Development/spark-1.6.3-bin-hadoop2.6/bin/spark-submit --master spark://tmcgrath-rmbp15.local:7077 --packages org.apache.spark:spark-streaming-kafka_2.10:1.6.3,datastax:spark-cassandra-connector:1.6.1-s_2.10 --class com.datastax.killrweather.WeatherStreaming --properties-file=conf/application.conf target/scala-2.10/streaming_2.10-1.0.1-SNAPSHOT.jar`At this point, metrics should be recorded in hostedgraphite.com. Let’s go there now.
4. Confirm Graphite and Configure Grafana
Let’s go back to hostedgraphite.com and confirm we’re receiving metrics. There are few ways to do this as shown in the screencast available in the References section of this post. One way to confirm is to go to Metrics -> Metrics Traffic as shown here:
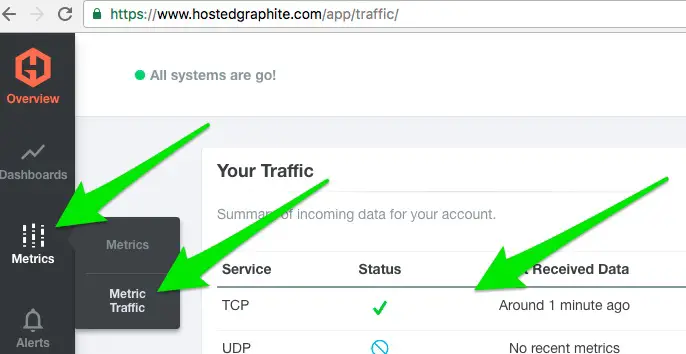
Once metrics receipt is confirmed, go to Dashboard -> Grafana
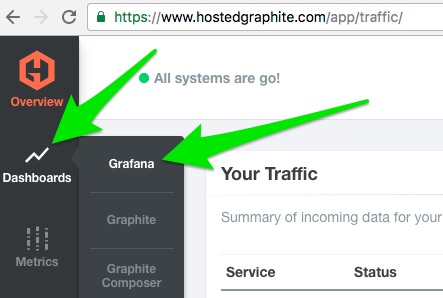
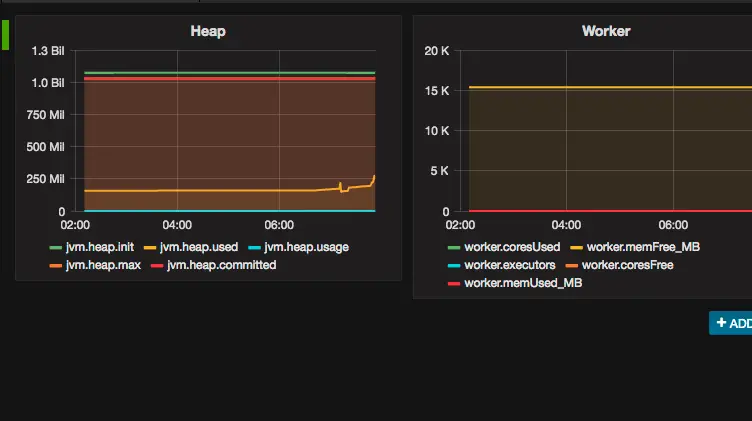
At this point, I believe it will be more efficient to show you examples of how to configure Grafana rather than describe it. Check out this short screencast
Eat, Drink, Be Merry
Seriously. Do that. Eat, drink and be merry. Because, as far as I know, we get one go around. So, make sure to enjoy the ride when you can. Hopefully, this ride worked for you and you can celebrate a bit. And if not, leave questions or comments below.
References
Screencast of key steps from this tutorial
- Metrics
- Graphite
- Grafana
- Spark Monitoring with Metrics
- Other Spark monitoring tutorials include Spark Performance Monitoring with History Server and List of Spark Monitoring Tools and Options
- Don’t forget Spark Tutorial landing page and Spark Scala Tutorials
Notes
You can also specify Metrics on a more granular basis during spark-submit; e.g.
spark-submit --master spark://tmcgrath-rmbp15.local:7077 --packages org.apache.spark:spark-streaming-kafka_2.10:1.6.3,datastax:spark-cassandra-connector:1.6.1-s_2.10 --class com.datastax.killrweather.WeatherStreaming --properties-file=conf/application.conf target/scala-2.10/streaming_2.10-1.0.1-SNAPSHOT.jar --conf spark.metrics.conf=metrics.properties --files=~/Development/spark-1.6.3-bin-hadoop2.6/conf/metrics.properties